
__
Isotype
The International System Of TYpographic Picture Educationwas developed by the Viennese social scientist and philosopher Otto Neurath (1882-1945) as a method for visual statistics. Gerd Arntz was the designer tasked with making Isotype’s pictograms and visual signs. Eventually, Arntz designed around 4000 such signs, which symbolized keydata from industry, demographics, politics and economy. Otto Neurath saw that the proletariat, which until then had been virtually illiterate, were emancipating, stimulated by socialism. For their advancement, they needed knowledge of the world around them. This knowledge should not be shrined in opaque scientific language, but directly illustrated in straightforward images and a clear structure, also for people who could not, or hardly, read. Another outspoken goal of this method of visual statistics was to overcome barriers of language and culture, and to be universally understood. The pictograms designed by Arntz were systematically employed, in combination with stylized maps and diagrams. Neurath and Arntz made extensive collections of visual statistics in this manner, and their system became a world-wide emulated example of what we now term: infographics.
Standardization
Apart from being the acronym of ‘International System Of TYpographicPicture Education, isotype is also Greek for ‘the same sign’. This last meaning summarizes the essence of the system: standardization. By developing a standard for the way in which information is represented visually, Neurath changes a style of illustration into a coherent visual language, providing strict rules for making ‘visual texts’. Because of this standardization, generic symbols (‘man’, for instance) can, by means of small variations or additions (such as a cap or standardized signs for various industries) acquire a specific content (‘worker in the steel industry’). This way also, various data become comparable.
Apart from being the acronym of ‘International System Of TYpographicPicture Education, isotype is also Greek for ‘the same sign’. This last meaning summarizes the essence of the system: standardization. By developing a standard for the way in which information is represented visually, Neurath changes a style of illustration into a coherent visual language, providing strict rules for making ‘visual texts’. Because of this standardization, generic symbols (‘man’, for instance) can, by means of small variations or additions (such as a cap or standardized signs for various industries) acquire a specific content (‘worker in the steel industry’). This way also, various data become comparable.
Images
The Isotype symbols were not meant to completely replace words, but to summarize and support the verbal content of the statistics. Due to this visual summary, less text is needed as well – the images give the relations, so that the text can be limited to key words instead of sentences. Important for the overview is the way in which the symbols are employed within the page’s grid. Here too, simplicity rules: horizontal arrangement represents changes in quantities, while vertical arrangement shows a passage of time or a comparison between various data. An accompanying illustration (Führungsbild) sometimes appears in the background of these infographics to enliven the composition and to add a geographical or content-related connotation.
The Isotype symbols were not meant to completely replace words, but to summarize and support the verbal content of the statistics. Due to this visual summary, less text is needed as well – the images give the relations, so that the text can be limited to key words instead of sentences. Important for the overview is the way in which the symbols are employed within the page’s grid. Here too, simplicity rules: horizontal arrangement represents changes in quantities, while vertical arrangement shows a passage of time or a comparison between various data. An accompanying illustration (Führungsbild) sometimes appears in the background of these infographics to enliven the composition and to add a geographical or content-related connotation.
Science
Many of Neurath’s contemporaries rendered proportions by varying the size of their symbols. But according to Neurath’s Isotype rules, more or less are not represented by bigger or smaller symbols, but by more or less symbols, each symbol representing a specific amount. In this manner, relations can be read more easily and exactly. In his representation, Neurath as it were gives the ruler, which is absent in other methods.
Many of Neurath’s contemporaries rendered proportions by varying the size of their symbols. But according to Neurath’s Isotype rules, more or less are not represented by bigger or smaller symbols, but by more or less symbols, each symbol representing a specific amount. In this manner, relations can be read more easily and exactly. In his representation, Neurath as it were gives the ruler, which is absent in other methods.
Simplification
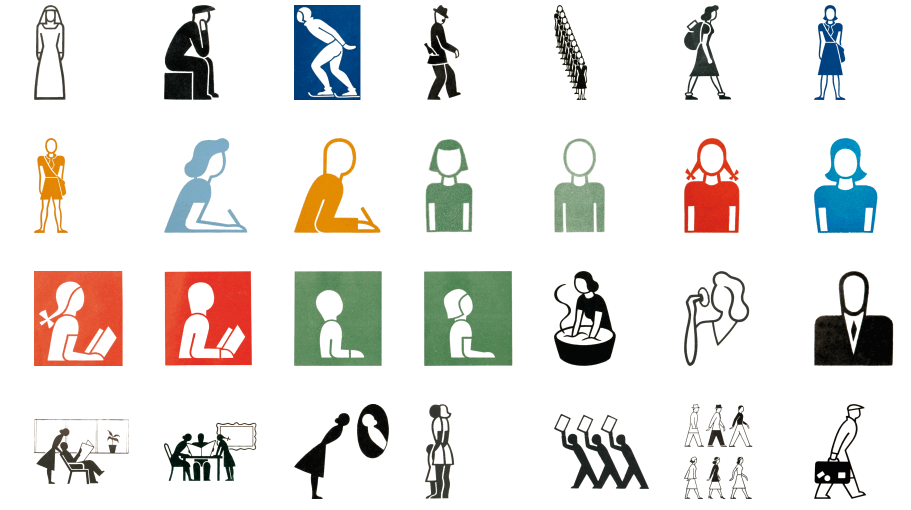
Gerd Arntz, commissioned by Otto Neurath, developed the Isotype visual dictionary, consisting of over 4000 symbols. The idea was that images can bridge differences of language, are easy to grasp and, when done well, also nice to look at. The legibility of Isotype is determined by the simplicity of its symbols. These should be instantly recognizable,without any distracting detail. What counts is the general idea – for common use the precise details are of less importance. Or in Neurath’swords: ‘It is better to remember simplified images, than to forget exact figures.’
Gerd Arntz, commissioned by Otto Neurath, developed the Isotype visual dictionary, consisting of over 4000 symbols. The idea was that images can bridge differences of language, are easy to grasp and, when done well, also nice to look at. The legibility of Isotype is determined by the simplicity of its symbols. These should be instantly recognizable,without any distracting detail. What counts is the general idea – for common use the precise details are of less importance. Or in Neurath’swords: ‘It is better to remember simplified images, than to forget exact figures.’
Science
Many of Neurath’s contemporaries rendered proportions by varying the size of their symbols. But according to Neurath’s Isotype rules, more or less are not represented by bigger or smaller symbols, but by more or less symbols, each symbol representing a specific amount. In this manner, relations can be read more easily and exactly. In his representation, Neurath as it were gives the ruler, which is absent in other methods.
Many of Neurath’s contemporaries rendered proportions by varying the size of their symbols. But according to Neurath’s Isotype rules, more or less are not represented by bigger or smaller symbols, but by more or less symbols, each symbol representing a specific amount. In this manner, relations can be read more easily and exactly. In his representation, Neurath as it were gives the ruler, which is absent in other methods.
Simplification
Gerd Arntz, commissioned by Otto Neurath, developed the Isotype visual dictionary, consisting of over 4000 symbols. The idea was that images can bridge differences of language, are easy to grasp and, when done well, also nice to look at. The legibility of Isotype is determined by the simplicity of its symbols. These should be instantly recognizable,without any distracting detail. What counts is the general idea – for common use the precise details are of less importance. Or in Neurath’swords: ‘It is better to remember simplified images, than to forget exact figures.’
Gerd Arntz, commissioned by Otto Neurath, developed the Isotype visual dictionary, consisting of over 4000 symbols. The idea was that images can bridge differences of language, are easy to grasp and, when done well, also nice to look at. The legibility of Isotype is determined by the simplicity of its symbols. These should be instantly recognizable,without any distracting detail. What counts is the general idea – for common use the precise details are of less importance. Or in Neurath’swords: ‘It is better to remember simplified images, than to forget exact figures.’
Note from the editors
Gerd Arntz drew more than 4000 ‘signatures’ (pictograms or small illustrations) for Isotype to be used in visual statistics. Not all of these pictograms are reproduced on this website – we have made a representative selection of around 600 figures. This is also because the collection contains quite a few variants of the same or similar pictograms, since for each different size a separate linocut had to be made by hand. The same goes for each outline, fill or half-tone, while some pictograms are printed in different colors.
The pictograms and small illustrations shown on this website are scanned from the original prints in the Arntz archive of the Municipal Museum The Hague. This accounts for some irregularities, which resulted from hand printing the linocuts. Our only intervention concerns the background (usually brown or brownish paper) which was whitened by Ontwerpwerk to emphasize the contours of the drawings, whilst keeping the authenticity of the outlines intact.
The categories on this website are not ones Gerd Arntz used himself. We have grouped the various pictograms in a limited number of categories to enable the visitor to see them in context, to compare and contrast similar forms and subjects and to narrow your search.The filenames of the Isotypes are the ones under which the digital versions of the prints are archived in the Municipal Museum The Hague.
Statistics
The atlas Gesellschaft und Wirtschaft – Bildstatistisches Elementarwerk is a loose-leaf collection printed and published in Leipzig, 1930, and issued by Otto Neurath’s eponymous museum in Vienna. Together, the 100 visual charts, in Gerd Arntz’s austere design, provide an overview of the essential empirical data of the world at that time.
The atlas is a text book example of the ‘Vienna method’ to present generally accessible information regardless of language barriers with the aid of images. Neurath and Arntz further developed their method in the 1930s into Isotype.
The atlas is their major collection of visual statistics, and was used as Elementarwerk, meaning as an example of how to make complex information accessible, using a standardized visual language.
The 100 charts conjure up an image of populations of countries and continents, of world powers and their political and military relations, of trade and industry, the growth of cities and their social structure and workers’ conditions. Everything is orderly visualized in directly recognizable diagrams.
As a model for visual statistics, the atlas was a success. In 1931, Neurath and Arntz were invited to apply their method in a new institute for visual statistics in the Soviet Union: Isostat. Neurath also acquired commissions form other European countries and the United States, where his pupil Rudolph Modley started a similar institute.
Neurath and Arntz are also the fathers of the Dutch field of visual statistics, which they developed after their emigration to Holland in 1934, in their The Hague based Foundation for Visual Education. Neurath left again in 1940, this time for England, where he set up the Isotype Foundation and continued to work until his death in 1945. Arntz stayed in The Hague, and worked on Neurath’s legacy in the Foundation for Statistics, after the war.The atlas is a text book example of the ‘Vienna method’ to present generally accessible information regardless of language barriers with the aid of images. Neurath and Arntz further developed their method in the 1930s into Isotype.
The atlas is their major collection of visual statistics, and was used as Elementarwerk, meaning as an example of how to make complex information accessible, using a standardized visual language.
The 100 charts conjure up an image of populations of countries and continents, of world powers and their political and military relations, of trade and industry, the growth of cities and their social structure and workers’ conditions. Everything is orderly visualized in directly recognizable diagrams.
As a model for visual statistics, the atlas was a success. In 1931, Neurath and Arntz were invited to apply their method in a new institute for visual statistics in the Soviet Union: Isostat. Neurath also acquired commissions form other European countries and the United States, where his pupil Rudolph Modley started a similar institute.
Isotype:
____
People -


____
At work:


____
Nature:


____
Mobility:


Gerd Arntz used woodblock printing to create Isotype and ensure that it would be easily reproducible.

No comments:
Post a Comment